Table of Contents
- GIANTS Debugger/IDE
- Overview of panels
- Creating a new project
- Global and local variables
- Callstack panel
- Running new scripts during debugging
- Breakpoints
- Game output
- Searching in code
- Shortcuts
GIANTS Debugger/IDE
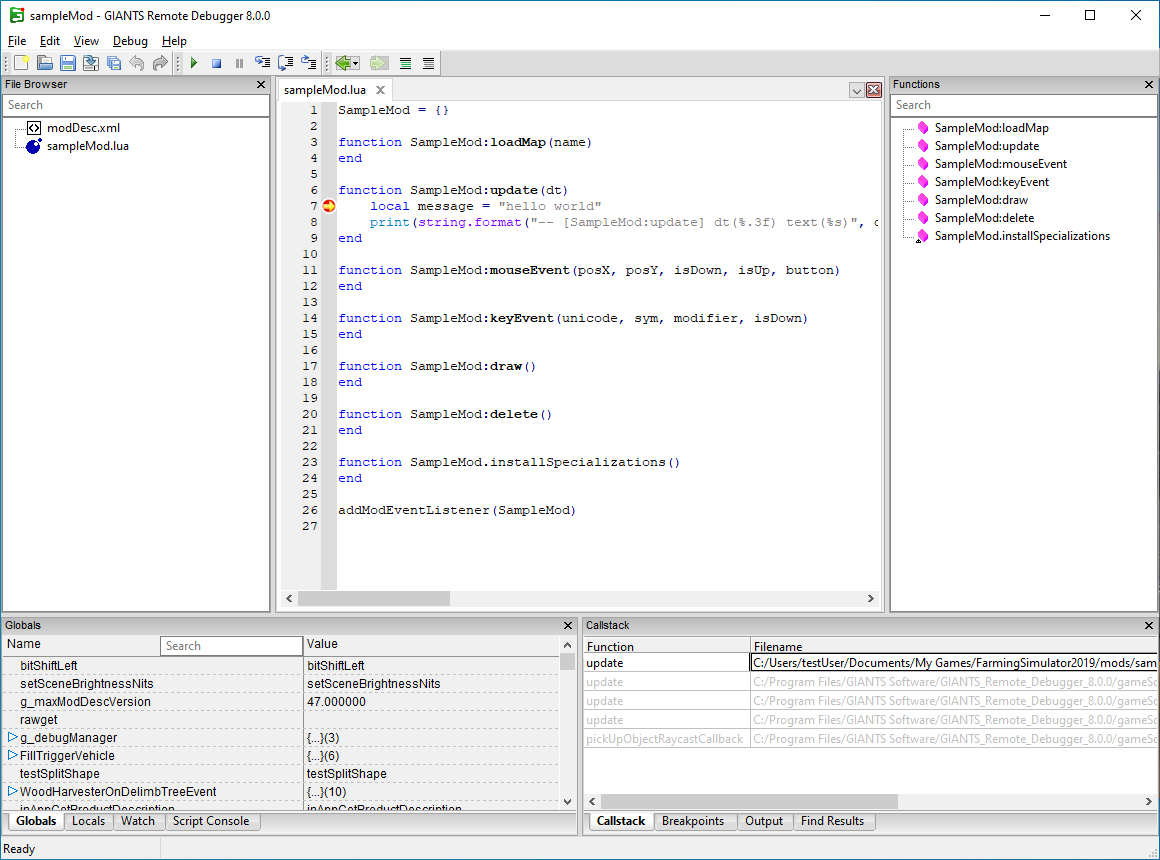
The GIANTS Debugger is a new tool for creating, editing and debugging script mods. It works as an editor and a “remote” debugger in one. It interacts with the game state and provides you with information about the game state.
Possible use-case scenarios:
- to create or modify LUA and XML files
- using breakpoints to see how script is executed
- investigating a paused game state by looking through callstack or inspecting variables
- seeing when and how variables change
- live-coding by writing script while the game is running
The Debugger can be used on all kinds of mod configurations. These are the most common three configurations:
Working on a single mod (fast iteration time, but only compatible with singeplayer):
Unzip your mod and put the mod in the “mods” directory (by default in Documents/My Games/FarmingSimulator2019/mods).
Make sure that the layout of the mod is correct, i.e. the modDesc.xml is directly in the mod folder (i.e. mods/
Working on multiple mods at the same time (fast iteration time, but only compatible with singeplayer):
Follow the instructions above, but when you create a project in the Debugger, set the “Mod Directory” to “mods” directory instead of the specific mod directory.
This way you can edit several mods at the same time.
In this configuration, the “Mod Name” is not important, you can call it anything you like.
Working on a single mod outside the “mods” directory (also compatible with multiplayer):
This is the most complex configuration, and it is the only one that lets you debug mods in multiplayer.
Place the mod zip file in the “mods” directory and unzip it somewhere else. In “Project Settings” set
the “Mod Name” to match with the name of the zip file but without .zip at the end) and set the “Mod Directory”
as a path to the unzipped directory.
For every change you make in the Debugger, you will have to re-create the mod zip file and copy it to the “mods” directory before you start the game.
External tools for zipping are useful for this purpose (not included).
Overview of panels
- File Browser: view files and folders in your project directory
- Functions: list of functions defined in the current file
- Globals: view global variables
- Locals: view local variables
- Watch: view the values of user-defined variables
- Script console: run user-defined parts of code
- Callstack: view current callstack
- Breakpoints: manage breakpoints
- Output: view log output
- Find Results: view results from the Find in Files dialog
Creating a new project
First you need to open or create a project.
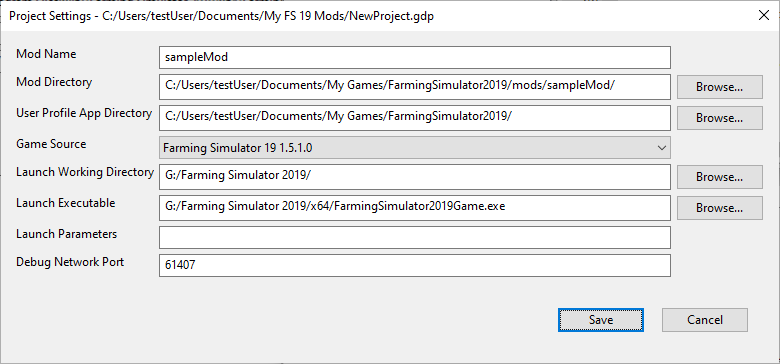
Most of the required parameters are self-explanatory. The “Mod Directory” can be a path to a single mod or a “mods” directory if you are working on several mods at the same time. If you are working on a single mod, the “Mod Name” must have the same name as the .zip file. The “User Profile App Directory” should be saved as a path to a folder where the game stores user data (changes are not needed by default if the game configuration has not been changed manually). The debugger uses sockets to communicate with the game and listens at the port defined as the “Debug Network Port”.
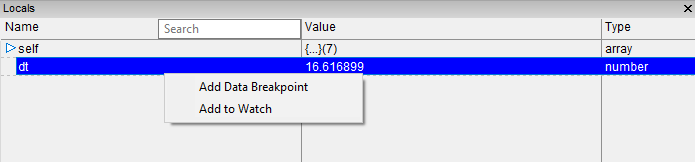
Global and local variables
The function of the “Globals” and “Locals” panels is the same: to explore the value of local and global variables at a current execution point (using breakpoints to halt execution and observe these variables, or by hitting the ‘break all’ button). By right-clicking on a variable, you can add it as a “Watch” or a “Breakpoint”.
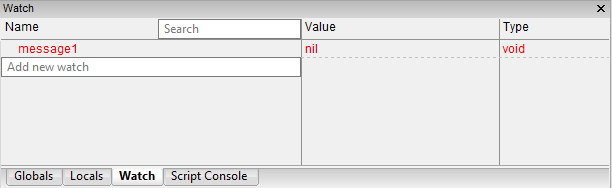
The ”Watch” panel is similar to the “Globals” and “Locals” panel, but instead of global or local variables, you can select variables that you would like to ‘watch’. Values are updated every time a breakpoint is hit or when you execute the code step-by-step. Variable names can be written like most other simple Lua statements:
- variableName
- object.member
- table[1]
- table[index]
- table[object.index]
Callstack panel
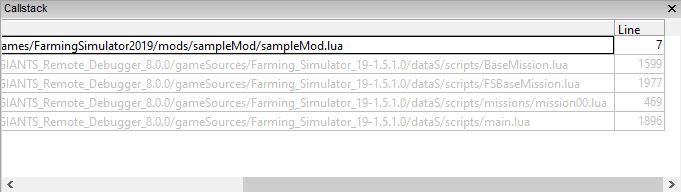
The “Callstack” panel shows you the callstack at a current execution point. Double-click on a line to open a file at the location of the call. The Debugger even allows you step through some of the base game functions for which the source code has been made public. Grayed-out lines are parts of code that have not been made public.
Running new scripts during debugging
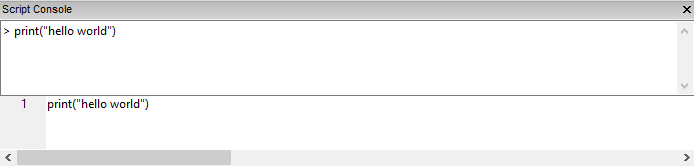
The “Script Console” executes user-defined Lua code when execution is paused (by hitting a breakpoint or break-all being pressed). Enter your code in the bottom part of the panel and press Ctrl + Enter to execute it.
Breakpoints
The “Breakpoints” panel is where you manage breakpoints.
Regular breakpoints can be placed in the code by clicking on the vertical gray bar on the left of the code panel. You can also use F9 to enable/disable a breakpoint at the current position. The program will stop running when it tries to execute a line with a breakpoint.
Data breakpoints can be placed by right-clicking on a variable name in the “Globals”/”Locals”/”Watch” panel or by right-clicking on a name in the text editor. A data breakpoint will be hit when the data for the specified variable changes.
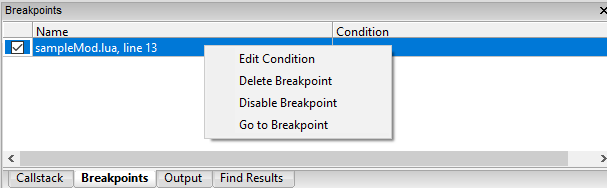
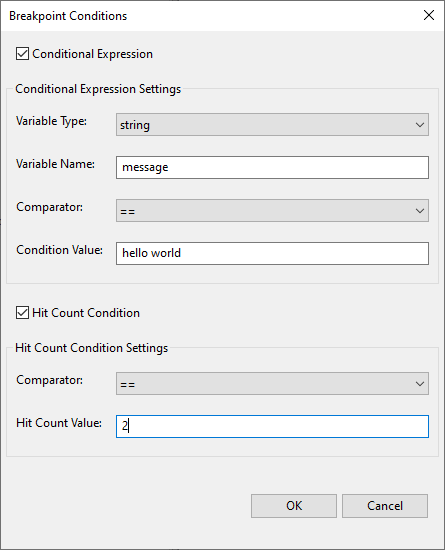
You can fine-tune a breakpoint by adding a conditional expression and/or hit count condition to it. These conditions are evaluated each time a breakpoint is hit and the code will only stop executing once the conditions are met.
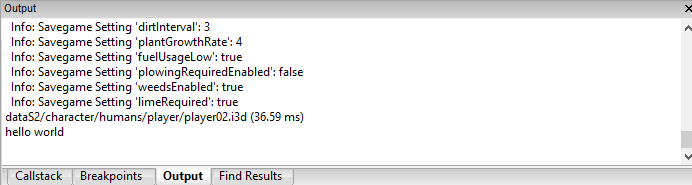
Game output
The “Output” panel shows the game’s log output. If a script error is reported, this panel will provide you with the file name and line number, so that you can double-click on it and view the code causing the error. The output is the same as the log file written by the game.
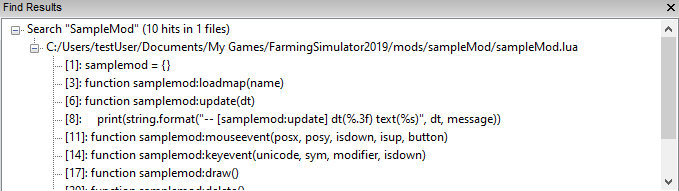
Searching in code
The “Find Results” panel shows search results from the “Find in Files” dialog. Double-clicking on a result opens a file at the search hit location.
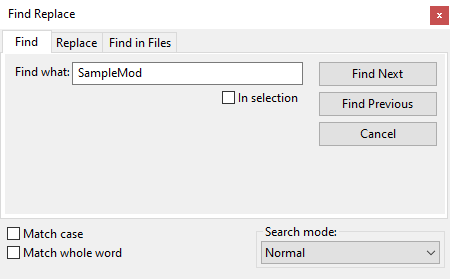
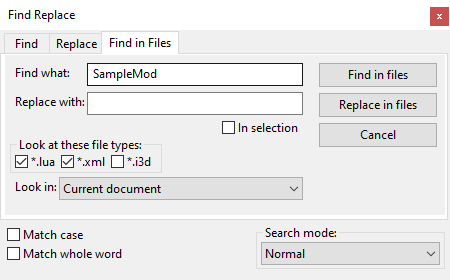
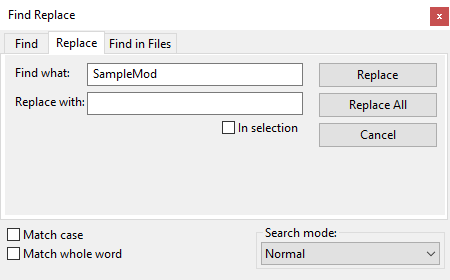
The “Find Replace” window behaves in a similar way to other text editors. “Find” and “Replace” directly show the results in the text editor; while “Find in Files” searches through the entire file and shows results in the “Find Results” panel. Other search modes are available too:
- “Extended” search allows you to use special “escape” characters (\t = tab, \n = new line, \r = carriage return, \0 NULL character and \\ = backslash)
- “Regular Expression” searches with regular expressions. Captures are defined with brackets ‘(‘ and ‘)' in the search string and can be placed with $1-$9 in the replace string.
Default keyboard short-cuts
| Key | Function |
|---|---|
| Ctrl-N | New file |
| Ctrl-O | Open file |
| Ctrl-S | Save file |
| Ctrl-Shift-S | Save all files |
| Ctrl-Q | Quit application |
| Ctrl-Z | Undo |
| Ctrl-Y | Redo |
| Ctrl-F | Find |
| Ctrl-H | Replace |
| Ctrl-Shift-F | Find in files |
| F3 | Find next |
| Shift-F3 | Find previous |
| Ctrl-Shift-G | Go to file |
| Ctrl-G | Go to line |
| Ctrl-K | Comment lines |
| Ctrl-Shift-K | Uncomment lines |
| Ctrl-W | Close tab |
| Ctrl-Shift-T | Reopen tab |
| Alt-Up | Move line up |
| Alt-Down | Move line down |
| Alt-Left | Navigate backwards |
| Alt-Right | Navigate forward |
| F5 | Run / Continue execution |
| Ctrl-F5 | Run Without Debugging |
| F7 | Pause execution |
| F6 | Stop execution |
| F9 | Toggle Breakpoint |
| F11 | Step Into |
| F10 | Step Over |
| Shift-F11 | Step Out |